
Using Stereovision for Crop Height Estimation
Published:
Co-authored by Jasanmol Singh (Ph.D. Student, Agriculture) and Shantanu Kore (Ph.D. Student, Bioengineering).
Crop height is a proven and crucial predictor of biomass quantity and availability. However, collecting this data in the field has historically been a bottleneck. Traditionally, researchers have relied on manual crop height measurement—a practice that is not only labor-intensive but also highly prone to fatigue and human error.
While modern techniques exist, they come with their own trade-offs. UAV-based Structure from Motion requires lengthy processing times, and satellite imagery often suffers from low temporal resolution, making real-time results impossible. Even ground-based methods, like ultrasound sensors, are limited because they are point-specific and fail to provide a complete spatial distribution of the crop canopy.
To bridge this gap, our recent project explores using Stereovision to automate and improve crop height measurement.
The Goal
Our primary objective is to develop a system that yields pixel-level crop height results. By utilizing stereovision, we can also capture additional RGB information about the crops, which paves the way for advanced 3D structural studies and deeper growth characterization.
The Stereo-Vision Processing Pipeline
To achieve this, we developed a robust stereo-vision processing pipeline.
First, we capture synchronized images of forage quadrants using a Luxonis OAK-D Depth Camera. As shown below, the camera utilizes a center RGB sensor alongside left and right monochrome sensors separated by a $60\text{mm}$ baseline distance.
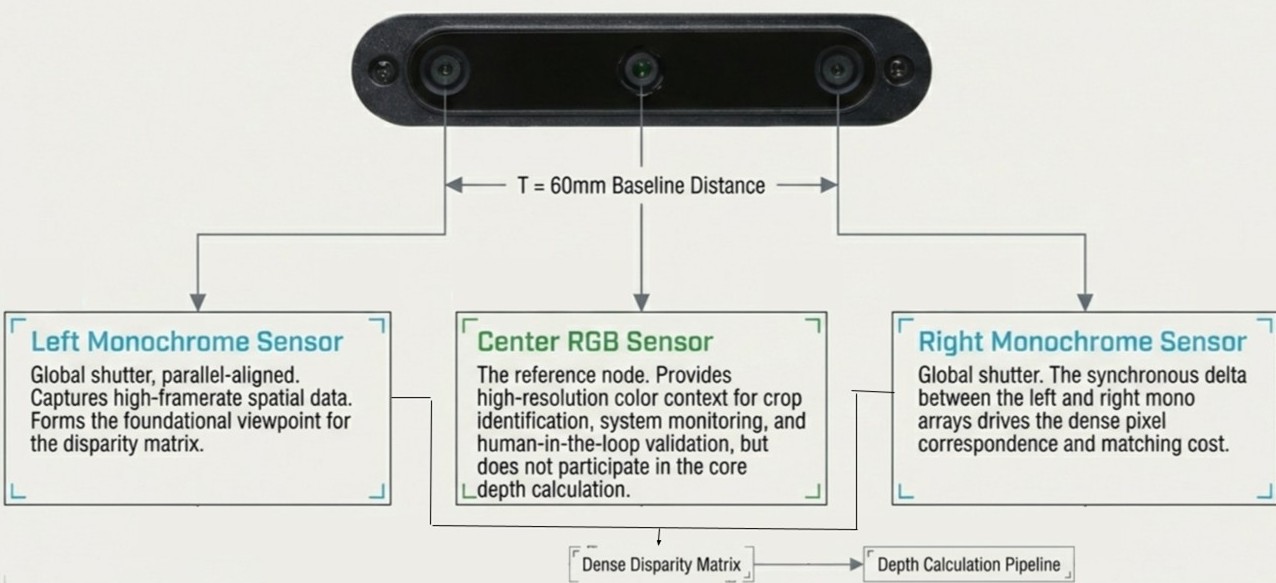
Camera sensor architecture and disparity matrix capture.
The system calculates the horizontal pixel shift (disparity) between the left and right images. Using basic optical geometry, depth ($Z$) is calculated using the baseline distance ($T$) and the focal length ($f$).
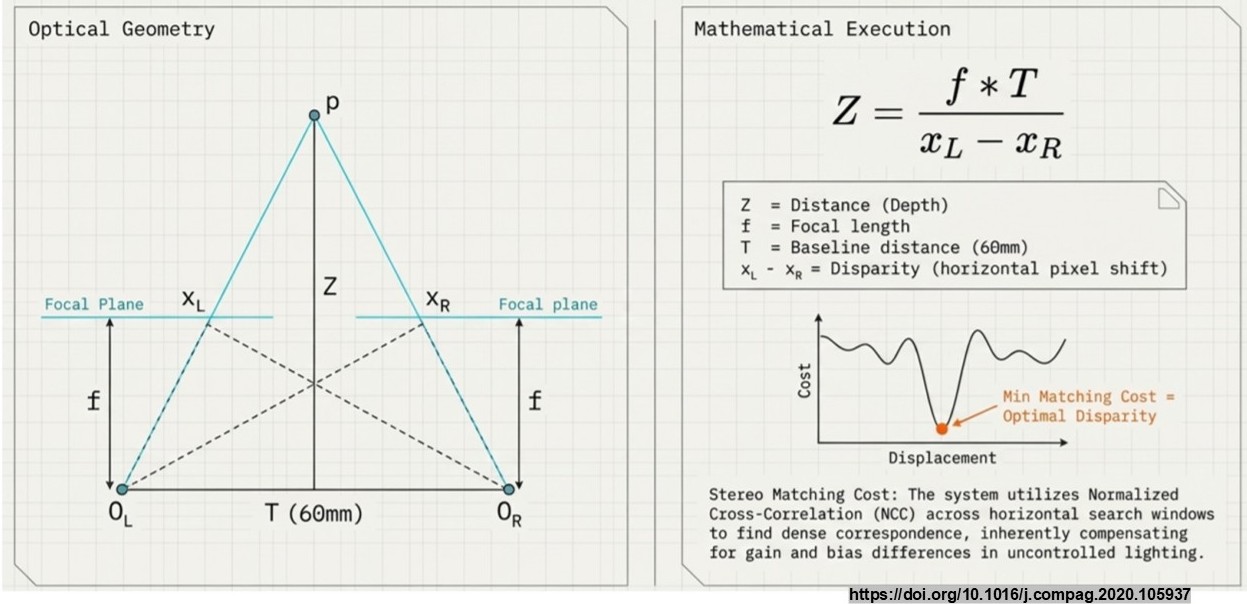
Optical geometry and disparity calculations utilizing Normalized Cross-Correlation (NCC).
Once the raw data is captured, the automated system executes a specific processing pipeline:
- Depth Data Preprocessing: Generating the raw disparity map.
- Ground Thresholding: Applying upper and lower spatial limits to isolate the crop envelope and ignore uneven ground data.
- Automated Averaging: Aggregating the thresholded data into a singular crop height value.
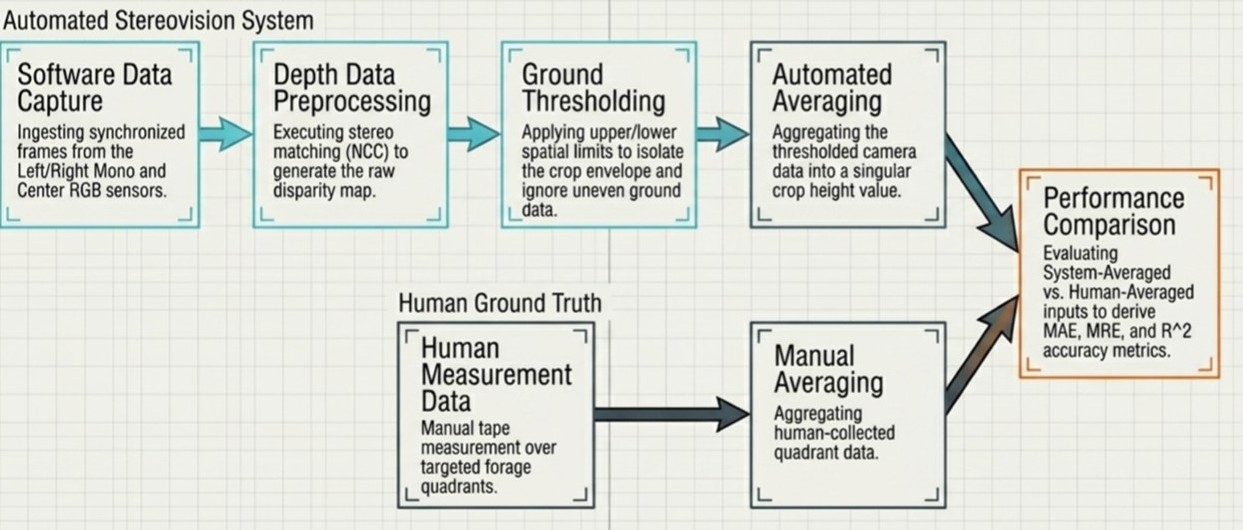
The complete processing pipeline from data capture to performance comparison against human ground truth.
Field Data Collection
For ground truth comparison against our automated pipeline, we built a physical mounting rod equipped with an Emlid Reach RS+ RTK-GPS to ensure high-precision spatial tracking.
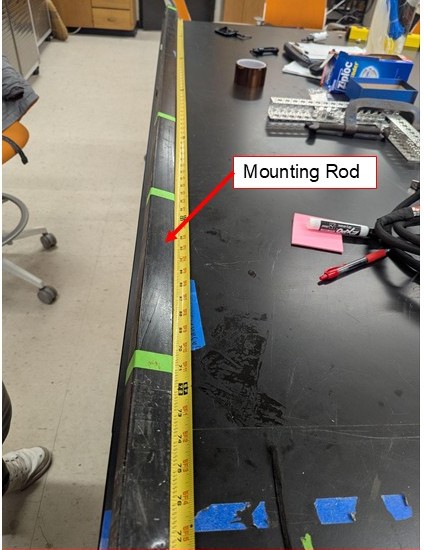
Fig 1: Custom mounting rod with precise length markings.
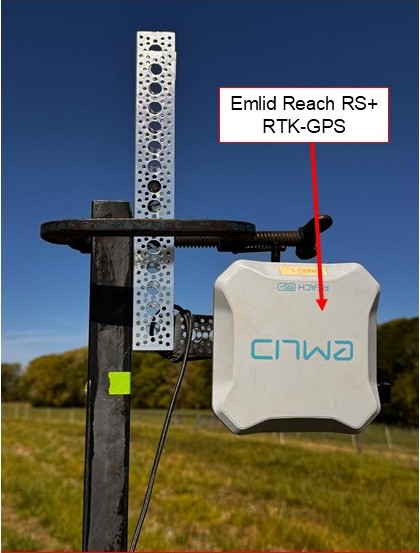
Fig 2: Emlid Reach RS+ mounted on the rod for GPS data collection.
We collected data at two different mounting heights in the field: $132\text{ cm}$ ($\sim 4\text{ ft}$) and $190\text{ cm}$ ($\sim 6\text{ ft}$).
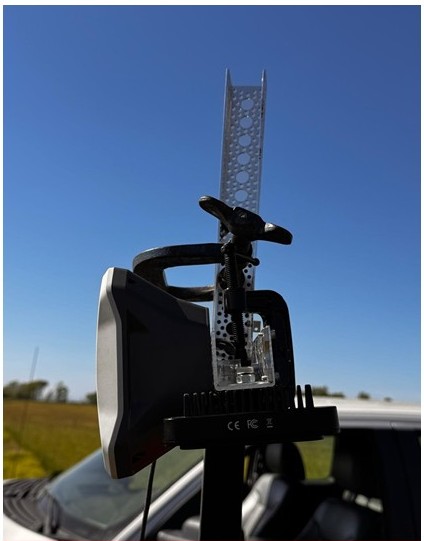
Fig 3: Close-up of the depth camera mounted on the collection rod.
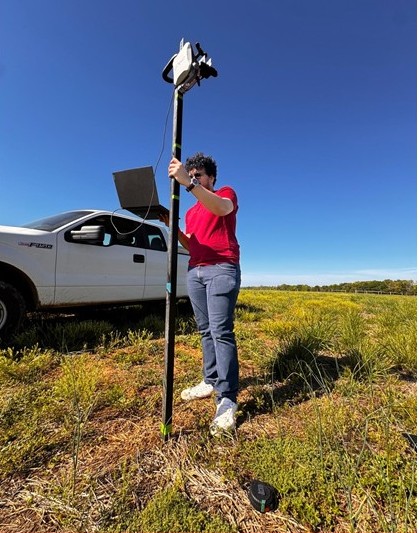
Fig 4: Active field data collection utilizing the depth camera and GPS rig.
To streamline this process, we developed a custom Crop Height Collector interface. This software ingests synchronized frames, allowing us to capture ground reference depth and canopy depth simultaneously alongside human manual tape measurements.
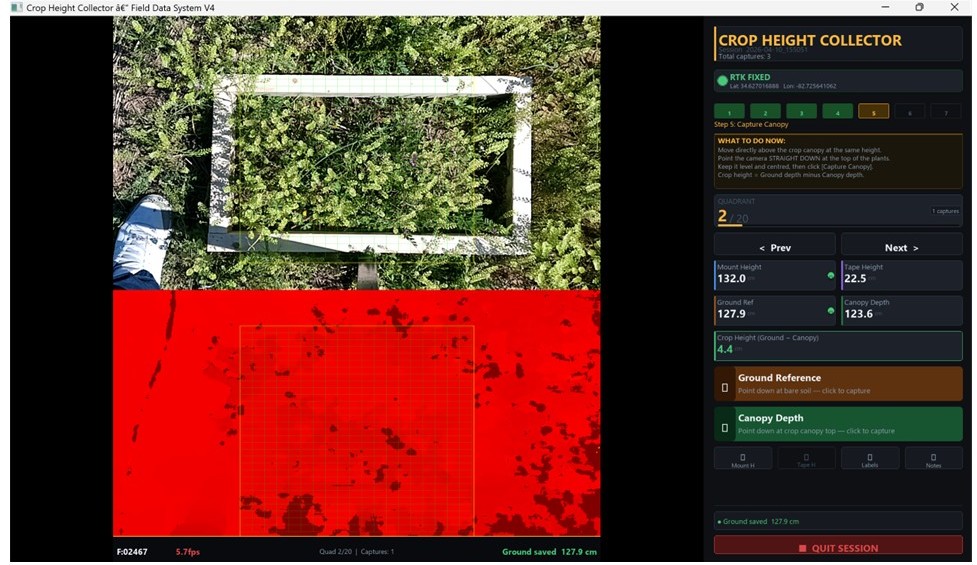
Fig 5: Software interface for capturing and logging ground reference and canopy depth.
Data Tables
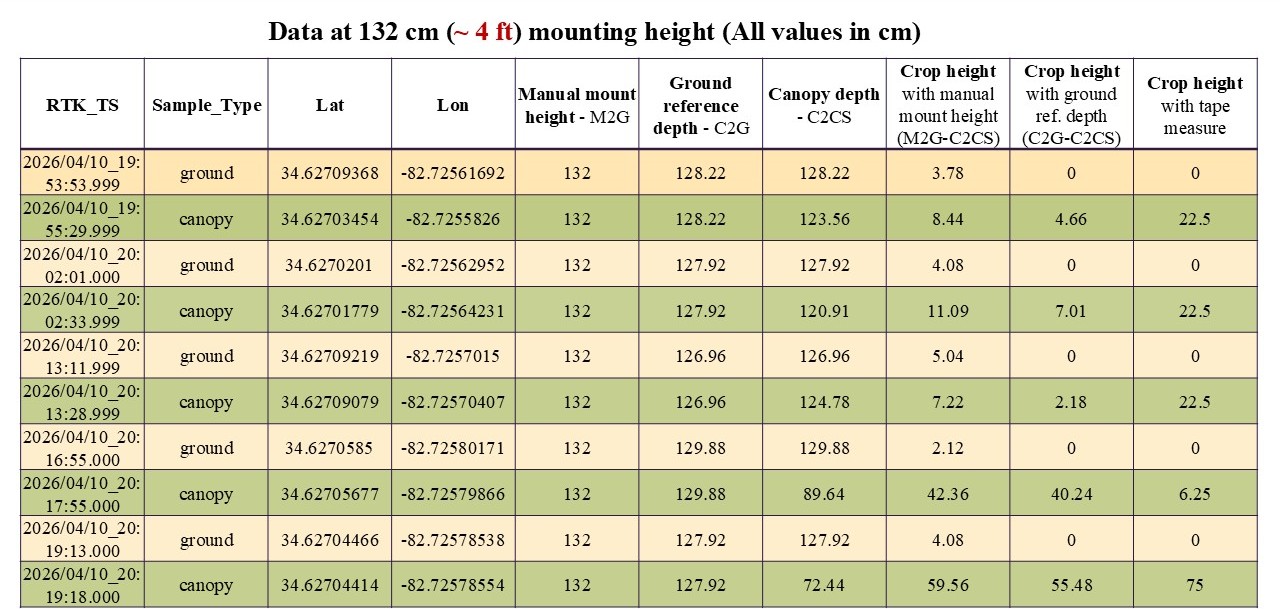
Table 1: Data collected at 132 cm (~4 ft) mounting height.
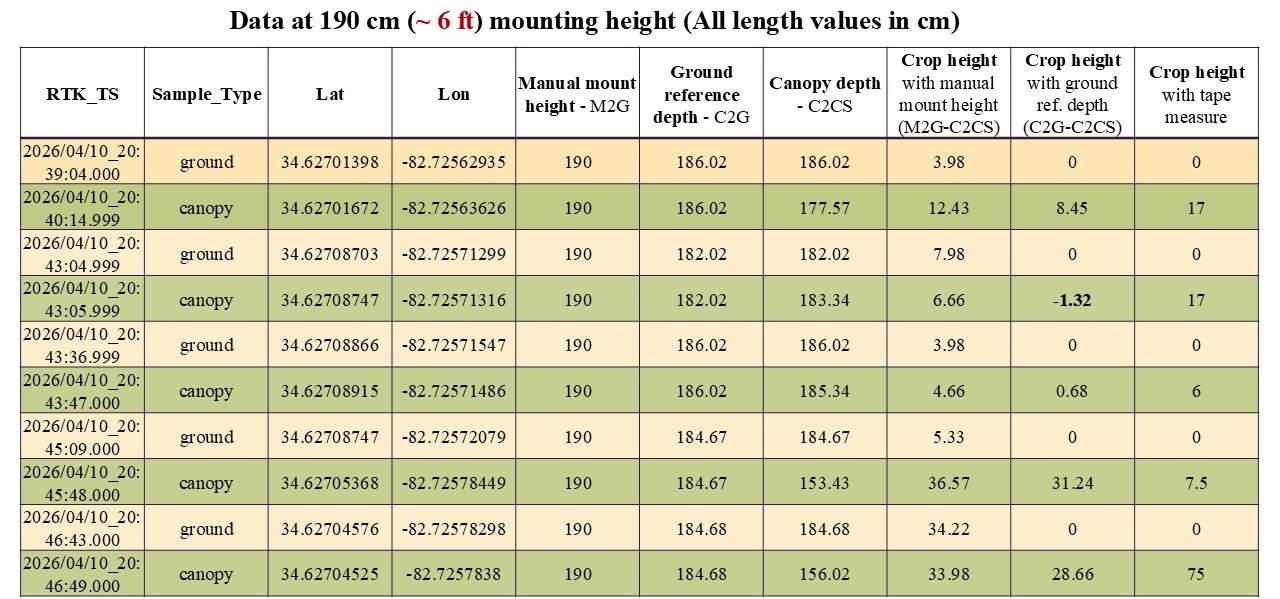
Table 2: Data collected at 190 cm (~6 ft) mounting height.
Results & Discussion
After processing the raw frames into depth heatmaps, we evaluated the system-averaged outputs against the human-averaged inputs.
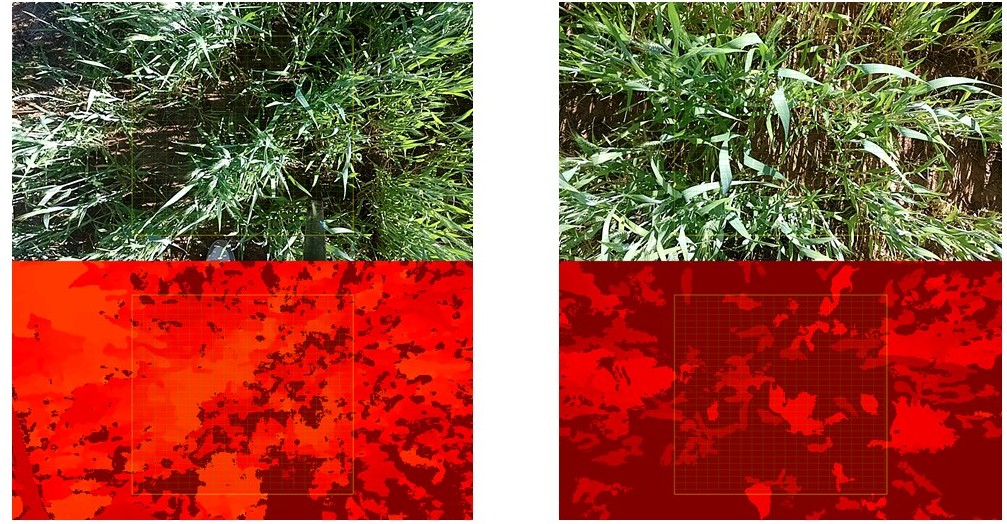
Fig 6: Sample RGB images and their corresponding depth heatmaps used for measurement.
Several interesting observations emerged from the data:
- System Objectivity: The crop height measured by the depth camera proved to be far more objective compared to the manual tape measure measurements.
- Mounting Considerations: We found that relying on a manual mount height made more sense, as perfectly flat ground conditions were rarely met during data collection.
- Human Bias in Manual Measurement: The manual crop height measurements were consistently higher than the depth camera-based measurements. Humans generally tend to measure the topmost outlier plants, ignoring the smaller plants growing beneath that also contribute to the true mean crop height.
- Environmental Variables: We observed a negative crop height value occasionally, which was attributed to hand shaking and unwanted vibrations during the data collection process.
Conclusion
Depth cameras and stereovision hold immense potential for providing highly accurate crop height measurements. As long as calibration and setup are done properly, and standard conditions are maintained during the data collection procedure, this technology offers a scalable, objective alternative to manual field labor.